Here’s the Latest Updated Winter Outlook for Michigan This Year
We are expected to have the perfect storm of perfectly fun and snow weather this winter.
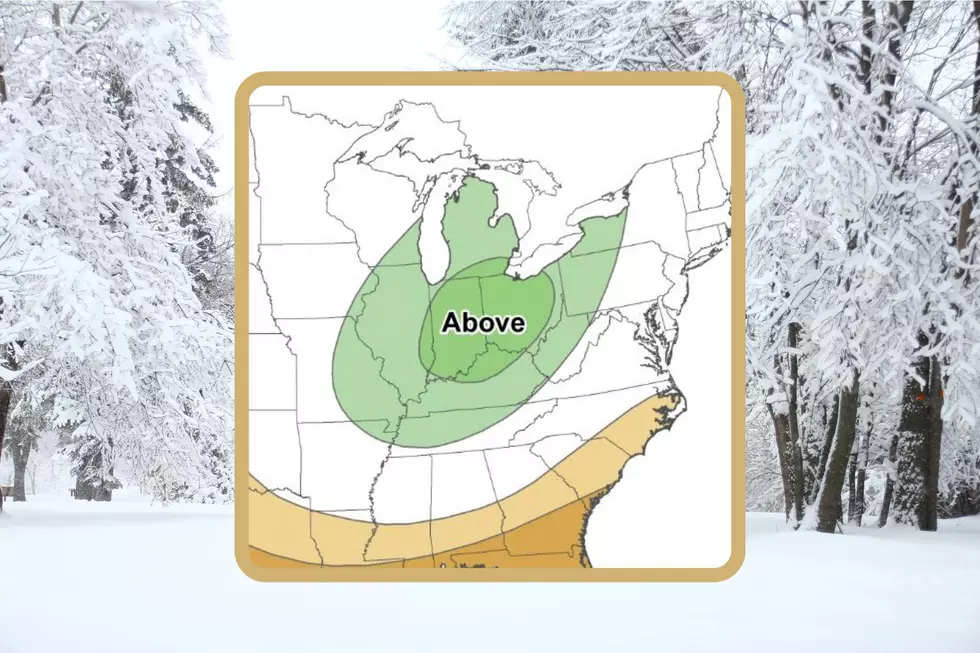
The National Weather Service recently released an updated weather outlook for December (2022,) January (2023,) and February (2023.) This outlook uses a basic scale of below average, average, or above average precipitation and temps. In my opinion, the outlook points to a fun and possibly very snowy winter.
Above Average Precipitation for Michigan.
Focusing on Southwest Michigan, the average snowfall depends on how close you are to Lake Michigan. According to CurrentResults.com, Benton Harbor averaged 77.7 inches of snowfall between 1991 and 2020. It snowed 31 days a year on average in Benton Harbor. Looking about 75 miles East of Lake Michigan, Battle Creek averaged 64.6 inches of snowfall with the white stuff coming down on average 45 days a year. Overall, the state of Michigan averages around 61 inches of snow a year.
The National Weather Service Precipitation Outlook for this winter shows Michigan, Indiana, and Ohio as being in the "above average" area of the map.
Average Temperatures for Michigan.
Weather-US.com says that Michigan's average low temp is around 22 degrees Fahrenheit with an average high temp around 34 degrees.

I'm no meteorologist, but I think the combination of above-average snowfall amounts and average temperatures means, we will have a Winter Wonderland like back in the day. The ability to enjoy a gorgeous snowy day in Michigan without the bitter cold temps has me excited about Winter for the first time in many years.
I wonder how much snow the cities below are going to see this year.
10 Snowiest Cities In Michigan
LOOK: The most expensive weather and climate disasters in recent decades
More From 94.9 WMMQ


